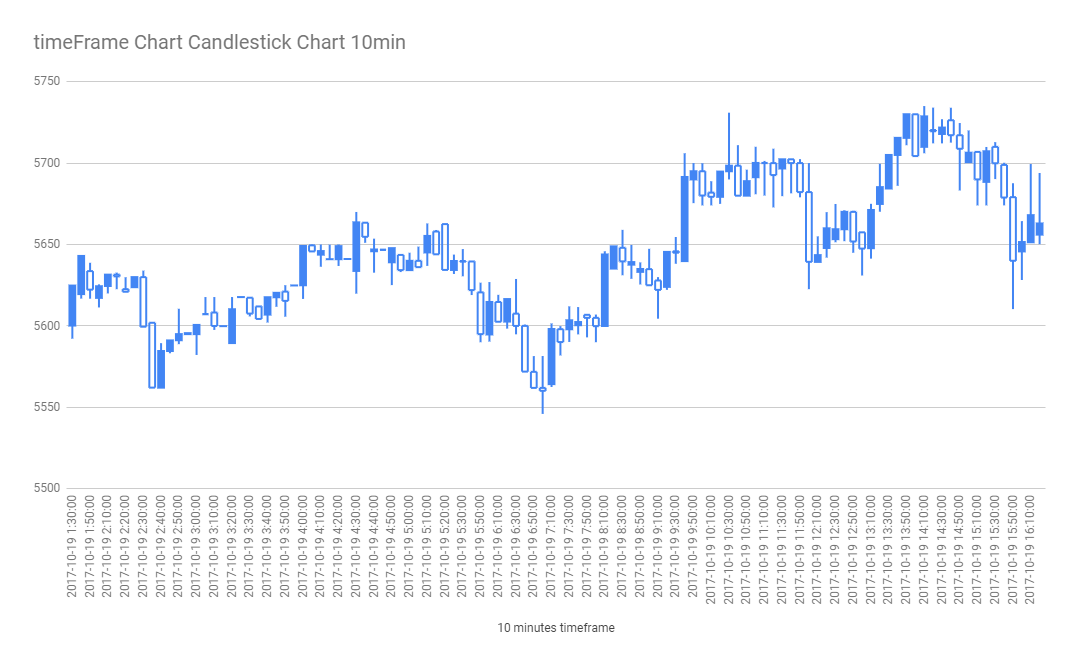
Freed from → charting-crypto-on-its-own-clock.
A blockFrame chart is a graphical representation of a crypto asset’s price movements over block heights instead of time — where the basic frame is one block, and multipliers of n blocks give the larger frames.
blockFrame instead of timeframe charting, for a universe — the blockchain — where objective time doesn’t exist, and succession materializes only by mining new blocks.
Time-frame charting
Price charts are graphical series of price movements over time: price on the Y-axis, time on the X. Time-frames like D (day), W (week), M (month) are sound for traditional finance, where instruments have trading hours and periodic cycles.
Block-frame charting
In the blockchain universe there is no objective time in the absolute sense. The advance of this universe is finding a solution to a cryptographic problem that can’t be solved in a predictable time — and it’s only when the solution is found that the chain’s clock ticks: a new block.
So plot price over blocks. Each bar or candle represents one block; open is the price at the new block’s timestamp, close at the next. The frames become multipliers of n blocks — tied to difficulty-adjustment cycles (Diff ≈ 2016 blocks in Bitcoin) or halving cycles (Halve = 210,000 blocks).
This is the same instinct as rindex: build models native to the true nature of the system, rather than importing traditional finance wholesale.